News | May 14, 2018
GRACE-FO Will Help Monitor Droughts
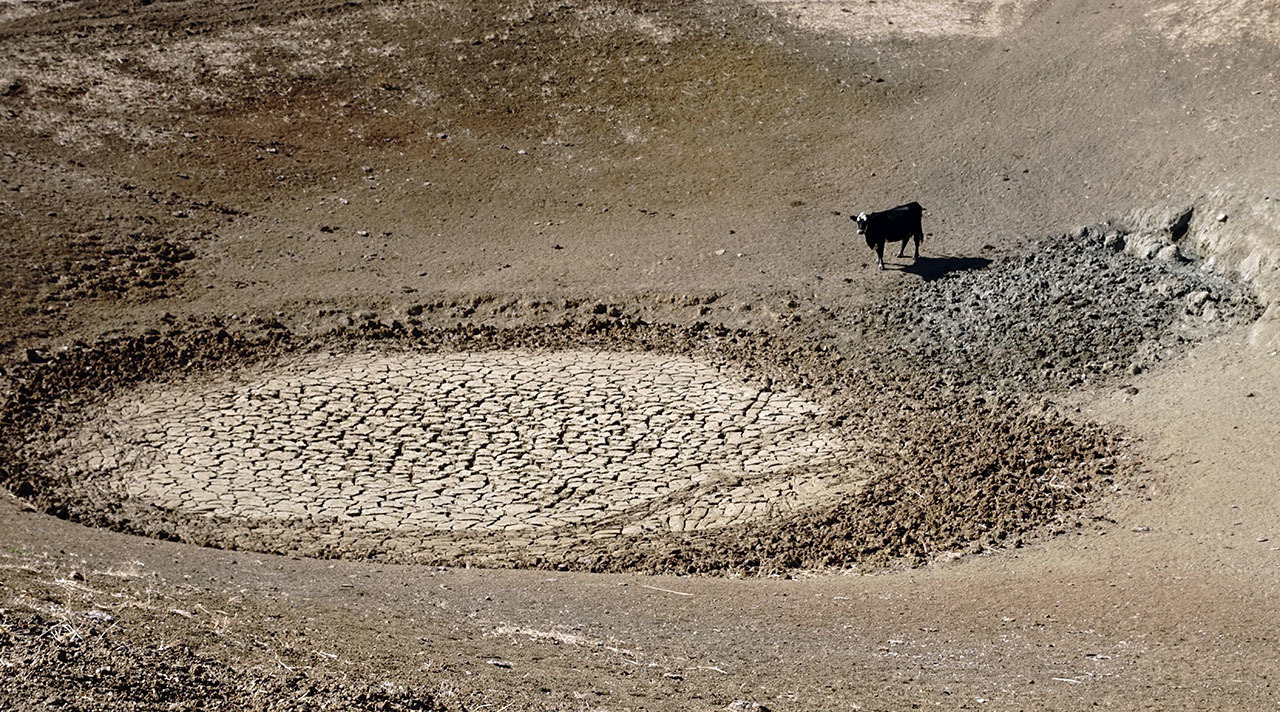
GRACE Follow-On's measurements of changes in water stored underground will be used in producing the U.S. Drought Monitor's weekly maps, one of the nation's most important tools for tracking drought nationwide. Credit: USDA
You may not notice water in the ground under your feet, but it plays an important role in keeping you alive. Plants draw water from soil into their roots and use it to grow. If there's not enough, the resulting drought may have impacts that spread across local water supplies, regional agriculture and even international food prices. NASA's Gravity Recovery and Climate Experiment (GRACE) mission was the first satellite system to directly measure global changes in the water stored underground in the world’s largest aquifers. GRACE Follow-On, scheduled to launch this month, will continue this important task.
"There really are no remote sensing products that are equivalent to GRACE data in giving a snapshot of conditions in deep aquifers," said Brian Wardlow, director of the Center for Advanced Land Management Information Technologies at the University of Nebraska, Lincoln. Wardlow is familiar with the value of this information in understanding drought. He worked at the National Drought Mitigation Center (NDMC) in Lincoln when the original GRACE data were first incorporated into experimental products of the weekly U.S. Drought Monitor maps. The maps show soil moisture at three underground levels: the top few inches of soil, the top few feet/one meter of soil (the root zone), and aquifers.
The U.S. Drought Monitor maps are one of the nation's most important tools for tracking drought across the United States. They are widely used by decision makers at federal and state levels. For example, the current U.S. Farm Bill designates the Drought Monitor's county-by-county drought rankings as the standard for judging eligibility for some federal disaster assistance programs.

The NDMC also considered GRACE data in producing other NDMC resources such as the Quick Drought Response Index (QuickDRI), a NASA-supported project with multiple institutional partners. QuickDRI is an early warning system for flash droughts -- rapidly developing losses of soil moisture due to heat waves and lack of rain. The onset of a flash drought is hard to detect at ground level, but its impacts on agriculture may be as harsh as those of a seasonal drought.
Getting the Data into the Maps
When GRACE launched in 2002, the science team knew the data would be useful for measuring the depletion of large aquifers. However, most hydrologists were unfamiliar with the measurement. One of the few exceptions was Matt Rodell, now chief of the Hydrological Sciences Laboratory at NASA's Goddard Space Flight Center in Greenbelt, Maryland. Rodell had recently done his doctoral research on how the new GRACE data could be used for monitoring underground water.
Since the techniques used by GRACE record the total change in mass from month to month, not whether that change occurred above ground, near the surface in the soil, or well below ground, Rodell and Jay Famiglietti, now at NASA's Jet Propulsion Laboratory in Pasadena, California, needed to combine the GRACE data with meteorological and other data to separate the underground water changes from above-ground and near-surface changes. After several experiments with the combined observations, Rodell and Famiglietti were able to isolate the signal of changing water in aquifers for the first time ever using remote sensing data.
Another obstacle between GRACE and operational drought monitoring was a mismatch in time and spatial scales. GRACE data products were produced once a month with a resolution of about 115 square miles (300 square kilometers). Water managers need new data every few days to keep up with changing soil moisture, and they would prefer to have it on the scale of their county, district or similar smaller area. Rodell and his team at Goddard assimilated the GRACE data and a long-term record of weather observations such as precipitation, temperature and solar radiation into a NASA hydrology model, called the Catchment Land Surface Model. It is a numerical model of water and energy processes on land, developed for research on the global water cycle. With sophisticated numerical modeling techniques and data analysis, the Goddard team was able to downscale the GRACE data, that is, to adapt its larger time and space scales to "fit" the model’s finer scales.
The team generated experimental drought indicators from downscaled data each week from 2011 until the GRACE mission ended in October 2017.
Looking Ahead
Because the original GRACE mission ended after the end of the growing season last fall, NDMC's Fuchs said that its loss has not yet been strongly felt by the Drought Monitor mappers. "We would be looking for GRACE in the growing season, where soil moisture is pertinent to determining crops and vegetation," he said. "In a couple more months, people will be asking, 'Where are these data?'"
Those people will most likely have their answer before the 2019 growing season, as GRACE Follow-On begins delivering monthly maps. Fuchs said, "If it's going to behave as GRACE did in the past, it will be a valuable asset."